Now that we have covered on a high level how to leverage data in Trust and Safety, we will discuss the technical aspects of how to analyze the data in the following section.
Please note that the following section is not intended to be a substitute for formal training in statistics, research, and data. It serves only as a broad introduction to common statistics that may be used in trust and safety, with the goals of (a) providing a general direction for data professionals entering the field of trust and safety; and (b) cultivating basic understandings of statistics for trust and safety professionals working closely with data experts.
Descriptive vs. Inferential Statistics
Most practical statistics can be divided into two categories: descriptive statistics and inferential statistics. Descriptive statistics primarily involve evaluating and measuring the key features and characteristics of a data set. Basic summary statistics such as mean, median, and standard deviation are descriptive, as are most performance indicators. A graph showing the average rate of penalization over time would be a common use case of descriptive statistics.
Inferential statistics, by contrast, involve making inferences from the data: trying to draw useful conclusions or make predictions based on the evidence available, often based on statistical tests. Common examples include regression analysis which tests if two or more variables are related, and hypothesis testing which tests if sample population data is consistent with a statement about that population. Inferential statistics are mostly based around probabilities (how likely it is that a given conclusion is true) and in practice often require more domain knowledge about causes and effects. An example of inferential statistics would be evaluating data before and after a policy change to see if the change had any significant effects.
Relationships, Correlations, and Causation
If a relationship between A and B is detected, there are four possible explanations (see below). Understanding these nuances (see the Appendix for more resources) in data can help one determine which conclusions can reasonably be drawn on the data and what interventions, procedures, and/or policies the data may recommend.
- Spurious correlations (see examples here)
- A third variable or multiple third variables influencing both A and B
- A causes B
- B causes A
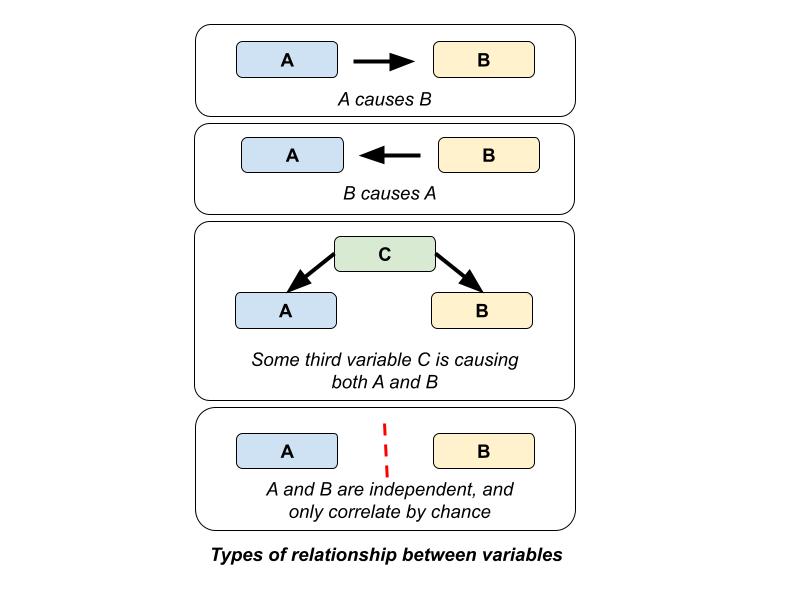
For example, suppose one was looking at the relationship between the number of monthly policy changes (A) and the number of monthly penalties (B), and that both seem to be increasing together. This could be a coincidence with the increases happening for independent reasons. It could be the result of a third variable, such as an increase in staffing to both find more violations and create new policies. A could have caused B, with the new policies generating more penalties. Finally, B could have caused A, with the new penalties providing extra information that drove policy changes.
Sampling
Sampling Sizes
When measuring populations, it is often desirable to take estimates using samples rather than evaluate all of what might be a very large data set. This begs the question: What is an adequate sample size? There is usually not an exact set number (e.g., 300 responses are “correct,” but 299 responses are “incorrect”). However, samples that are too small may not provide enough detail and accuracy to detect smaller changes or to draw conclusions and make decisions, and samples that are too big may be impractical or expensive. The goal is to strike a balance based on the nature of the changes that one is trying to measure.
There are three key factors that affect sample size:
- Population size. Larger populations generally require bigger samples, although this varies depending on the details of the population and, past a certain point, this effect is weakened.
- Precision. How accurately a value can be measured (for example to within 1%)?
- Error rate. What are the odds that a meaningful change in the sample was just random chance?
It is also important to note that bigger samples will not fix problems like systemic bias in sampling or cherry picking of results. It is always best to use samples and statistics in context and to question unusual or unexpected behavior to understand the causes.
Stratification
When resources for sample review are limited there are various methods to maximize the useful information they provide. One of the most common examples of this is stratification. Although the technical details of how to implement stratification are beyond the scope of this chapter (see the Appendix for resources), we discuss the higher-level rationale and benefits of using stratification when considering trust and safety related data.
Stratification involves dividing the population into a set of different groups or strata, and selecting a sample from each separately. These samples can then be combined, weighting by their size if needed, to create a representative view of the population as a whole.
Stratification can be complicated to set up, but if done correctly it has several advantages:
- Stratification produces stable and consistent volumes of different types of reviews—useful if, for example, there are limited reviewers for a particular language;
- It allows for additional information in the areas that are most interesting;
- It allows detection and measurement of very rare but important events, such as imminent threats of mass violence;
- It prevents important groups from being underestimated in the sample by random chance.
Convenience Sampling
Convenience sampling, as the name suggests, involves taking samples based on convenience—that is, samples which are chosen based on easy access, availability, and low cost. Convenience samples are rarely statistically representative and are often, therefore, less useful as measurements, but they can still provide valuable directional information quickly and cheaply.
A good example of convenience sampling in trust and safety is an appeals process. Because appeals are being received and being handled regardless, they can be used to give ‘free’ information about other areas like review quality. However, appeals are more likely to skew towards borderline decisions and mistakes, and may not be representative of the quality of all reviewer decisions.
AB Testing
Although a full explanation of AB testing is beyond the scope of this chapter and many resources already exist on this topic (see the Appendix for resources), it is important to note that AB testing is routinely used in trust and safety. AB testing, a common research method, involves randomizing individuals into at least two conditions and testing how the conditions impact the outcome of interest.
For example, if rampant sharing of misinformation is a concern on a platform, one may elect to use AB testing to assess whether an intervention may reduce user likelihood of sharing misinformation. To do so, the platform may randomly split a portion of the users to experience a beta version where users will be asked whether they have verified the information prior to them being able to repost or share (i.e., experimental group), with the rest experiencing the current platform (i.e., control group). If data shows that the trend of sharing misinformation decreases in the experimental group, one may conclude that this intervention is effective and therefore implement it more broadly on the platform.